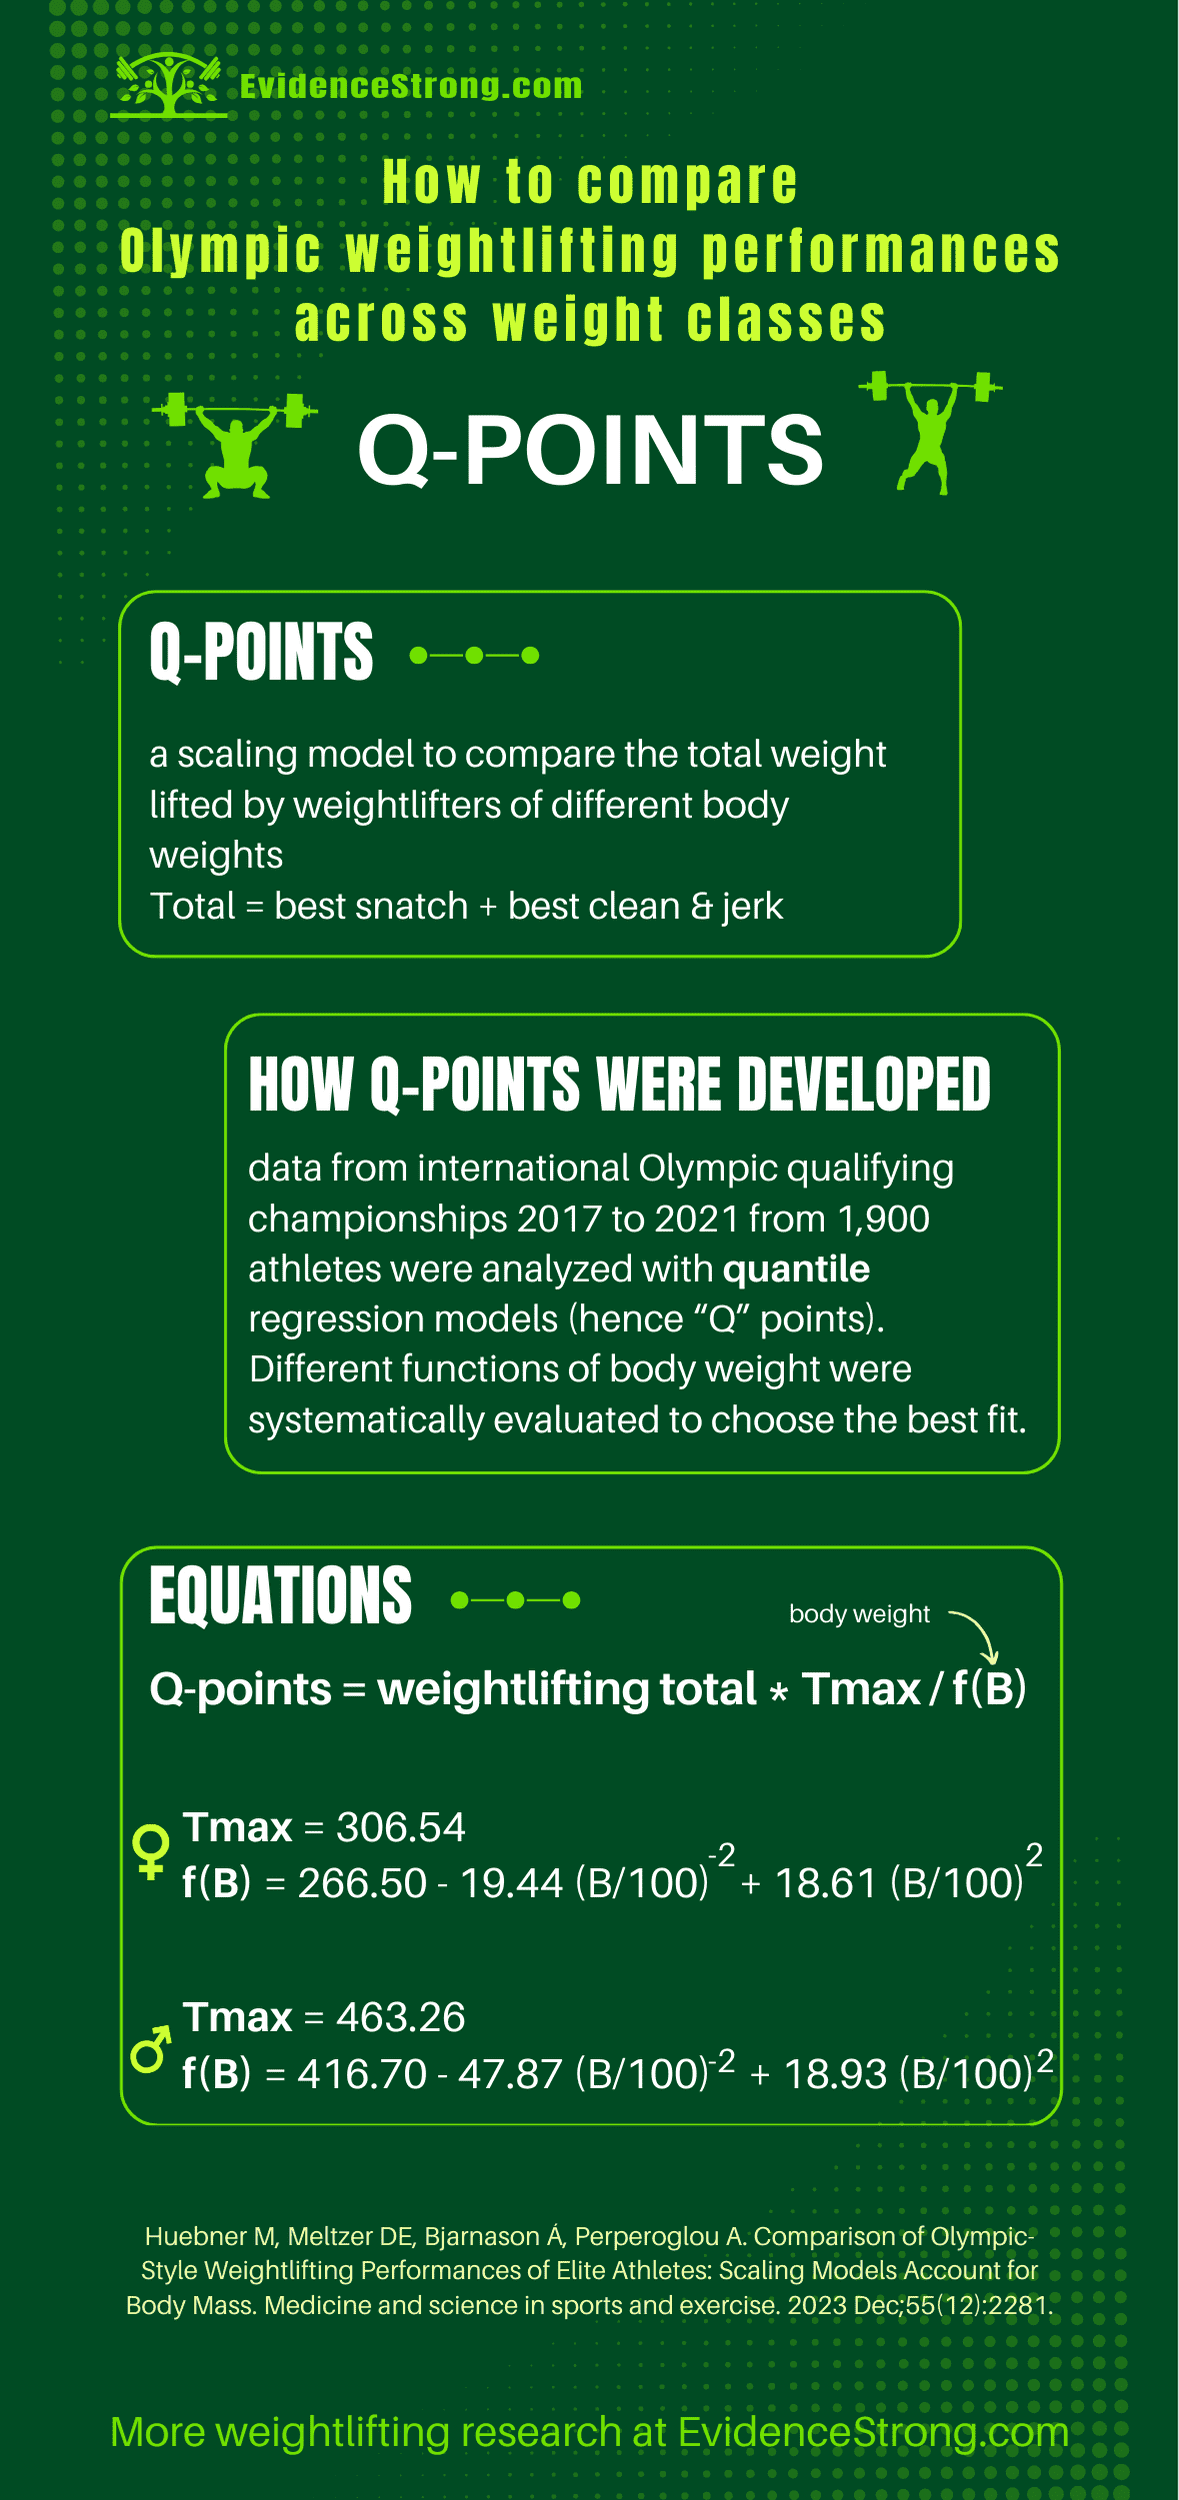
Summary of a study introducing a new method to compare Olympic weightlifting results between weight classes.
Who
1,900 athletes (813 females and 1,087 males) from 150 countries aged 21 to 30 years
Design
Data from the Olympics and World and Continental Championships from 2017 to 2021
Outcome measures/tests
- transformation of body weight (at the weigh-in) and Olympic weightlifting performances in the international competitions (totals = snatch + clean&jerk)
- testing whether the scaling model will hold up at the 90th, 75th, and 50th percentiles of weightlifting totals
Main results
why Q-points were needed:
- for selecting the best lifters in competitions,
- existing methods are based on world records and are prone to frequent changes and overvalue/undervalue performances in some body weight categories.
previously used methods:
- Sinclair scores - adjusts the total (snatch + clean&jerk) with coefficient for each weight category
- Robi points - a ranking system that ranks each performance (total = snatch + clean&jerk) in relation to the world record in that particular weight category
- body deduction system - athletes’ performance (total) has their body weight deducted, and the outcome is used to compare lifters
the new model - Q-points - uses body mass transformation (fractional polynomials, quantile regressions - hence the name)
Q-points are stable across the weight categories
the new method is also stable through 90th, 75th, and 50th percentiles of performances (not only for medalists or top 10)
key points in comparison of the Sinclair scores, Robi points used for Tokyo Olympics qualifying, and the new Q-points:
Take home message
Original article
Huebner M, Meltzer DE, Bjarnason Á, Perperoglou A. Comparison of Olympic-Style Weightlifting Performances of Elite Athletes: Scaling Models Account for Body Mass. Medicine and science in sports and exercise. 2023 Dec;55(12):2281.
Here is the Q-points web-based calculator:
You might want to read next
Predicting Olympic weightlifting performance at the international level
